Business
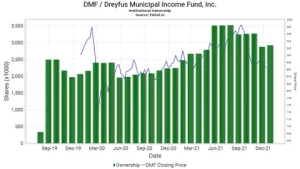
DMF Price Trend April 2026: Global Analysis & Forecast

Dimethylformamide DMF price climbed sharply in April 2026 across major global regions. Multiple forces worked together to push costs higher. First, producers faced rising feedstock expenses. At the same time, downstream buyers showed stronger demand. Finally, supply tightened in several key exporting countries. As a result, industrial consumption stayed steady, inventories remained limited, and prices continued to rise.
This monthly movement also showed up clearly in the DMF price index. The index captured firm market conditions and recorded consistent gains in many regions. Overall, April 2026 reflected a market that buyers could not easily outbid, mainly because supply stayed constrained while demand held its ground.
Northeast Asia (DMF) Price Index Analysis
In Northeast Asia, DMF prices reached USD 0.81/KG in April 2026. This represented a 37.3% rise, indicating a significant change from previous levels. The main drivers behind this rise include higher raw material costs and improved demand from key end-use industries.
Two sectors stood out. The pharmaceutical industry increased purchasing activity as formulations and production schedules moved forward. Meanwhile, the textile sector maintained demand for DMF-linked processes, supporting broader consumption. In parallel, exporters delivered tighter supply due to limited availability in the regional market.
The DMF price trend in Northeast Asia remains bullish. Strong export activity also played a role. When regional supply tightens at the same time that export demand stays active, prices typically keep moving upward. Based on the latest pricing analysis, Northeast Asia continues to experience uneven supply availability and resilient buyer interest, both of which support firm pricing.

Europe (DMF) Price Index Analysis
Europe recorded DMF prices of USD 1.99/KG in April 2026. This represented an 11.8% increase. The upward movement did not happen by chance. Higher production costs pushed manufacturers to quote higher levels. In addition, demand stayed stable from industries that regularly use DMF in coatings and chemical applications.
Energy costs also contributed to the price pattern. Chemical producers depend heavily on stable utilities and energy inputs. When energy prices rise, production expenses increase, and many costs flow through to end users.
Even with steady consumption, supply constraints helped keep European pricing firm. Because buyers faced limited flexibility in procurement, market participants continued to accept higher price levels rather than wait for immediate discounts. As a result, the Europe DMF price index maintained a consistent upward pattern throughout April.
India (DMF) Price Index Analysis
In India, DMF prices reached USD 1.84/KG in April 2026, growing by 17.2%. This increase reflected strong domestic demand and higher import costs. Even when local purchasing remains stable, price momentum can accelerate if imported supply becomes more expensive or harder to secure.
Domestic industrial users contributed meaningfully to demand. Buyers pulled more DMF to support routine production schedules and ongoing production runs. At the same time, limited local production capacity kept the market sensitive to import pricing.
The result was clear in the price chart: DMF prices in India moved higher and stayed positive. Stable industrial consumption supported the trend. Meanwhile, procurement remained constrained enough to prevent price corrections. So, April 2026 delivered a clear bullish signal for the Indian DMF market.
North America (DMF) Price Index Analysis
North America recorded DMF prices of USD 1.89/KG in April 2026. Prices rose by 31.3%, making this one of the strongest increases among major regions. Demand from pharmaceutical applications remained a key factor. Pharmaceutical supply chains often require dependable inputs, so strong purchasing can quickly tighten availability when supply adjustments lag behind.
Supply chain changes also influenced pricing. Even when shipments continue, procurement lead times can stretch due to logistical issues or shifting sourcing strategies. When lead times increase, purchasers typically order sooner. That behavior can increase short-term demand for available quantities, helping prices rise faster.
At the same time, controlled supply levels supported the upward trend. When sellers maintain tighter availability and buyers cannot easily switch sources, markets often sustain firm pricing. The DMF price forecast therefore points to continued firmness in the near term, provided demand stays stable and supply remains constrained.
Supply and Prices Overview: April 2026
Across April 2026, supply remained moderately tight in key regions. Asia and North America faced the most noticeable constraints. Demand stayed solid, and input costs increased further, which reinforced the upward price direction.
Europe, meanwhile, experienced steadier supply but elevated costs. Energy expenses and production overheads kept manufacturers from lowering quotes. Therefore, prices stayed firm even without extreme shortages.
In short, the market mix in April followed a consistent pattern: higher costs + steady demand + constrained supply. That combination supported double-digit increases in several regions and kept the overall DMF price index trending upward.
What Drives DMF Prices?
Demand also matters. DMF consumption remains strong in pharmaceuticals, textiles, coatings, and chemical manufacturing. When buyers increase orders, prices respond quickly.
Supply chain conditions further influence availability. Freight costs, logistics disruptions, and export restrictions can delay shipments. If delays persist, supply tightens and prices tend to rise. Production capacity also affects pricing. Plant shutdowns, maintenance, and limited expansion reduce output and apply upward pressure.
Finally, energy costs play a major role. Higher electricity and fuel expenses increase production costs and shift pricing upward across markets.
Future Outlook for DMF
Looking ahead, prices are likely to remain firm in the near term. Two factors support this view: steady industrial demand and controlled supply levels. However, volatility remains possible. If feedstock costs or energy prices rise further, DMF pricing could extend upward. Conversely, enhanced production capabilities or more efficient logistics could aid in stabilizing prices.
Author
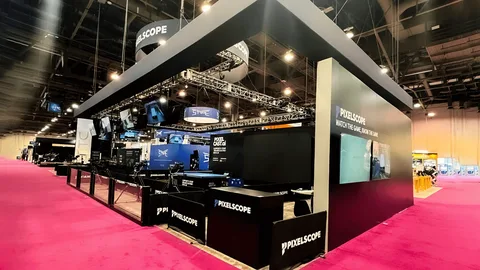
Las Vegas is globally recognized as one of the premier destinations for trade shows, conventions, and business expos. Every year, thousands of exhibitors from around the world gather in the city to showcase innovative products, launch new services, and connect with potential clients. With such intense competition on the exhibition floor, having a professionally designed booth is no longer optional—it’s essential. A visually striking, functional, and strategically planned exhibition booth can help your business attract more visitors, strengthen brand recognition, and generate valuable business opportunities.
As a trusted Trade Show Exhibition Booth Builder in Las Vegas, we specialize in creating custom exhibition booths that combine innovative design, quality craftsmanship, and seamless execution. Whether you’re exhibiting at a small industry event or a large international trade show, our turnkey booth solutions are tailored to help your brand stand out and achieve measurable results.
Why Exhibit in Las Vegas?
Las Vegas hosts some of the largest and most influential trade shows in the world. Industries such as technology, healthcare, consumer electronics, automotive, hospitality, food and beverage, construction, manufacturing, and retail all rely on Las Vegas events to introduce new products, network with decision-makers, and expand their market reach.
These exhibitions attract thousands of visitors, buyers, distributors, investors, and media professionals. This makes every trade show a valuable opportunity to increase brand awareness and build long-term business relationships. However, with hundreds of competing exhibitors, creating a memorable first impression is crucial. That’s where an experienced Exhibition Booth Builder in Las Vegas can make a significant difference.
The Importance of a Custom Exhibition Booth
Your exhibition booth is much more than a display space—it is the physical representation of your brand. Visitors often decide within a few seconds whether they want to engage with your booth, making design and presentation critical factors in your exhibition success.
A custom booth allows your business to showcase its unique identity while creating an inviting environment for visitors. Unlike standard modular booths, custom exhibition stands are designed specifically around your marketing objectives, products, and target audience.
A professionally designed booth offers several advantages:
- Enhances brand visibility
- Attracts more foot traffic
- Creates memorable visitor experiences
- Provides dedicated meeting areas
- Highlights products effectively
- Encourages visitor interaction
- Increases lead generation opportunities
- Improves return on exhibition investment
Our design team carefully balances creativity with functionality, ensuring your booth not only looks impressive but also supports your sales and marketing goals.
Custom Booth Design Tailored to Your Brand
Every business has different exhibition objectives, which is why we believe every booth should be unique. Our experienced designers collaborate closely with clients to understand their branding, target audience, product offerings, and event goals before developing a customized booth concept.
Our booth design services include:
- Creative concept development
- 3D booth visualization
- Brand-focused graphics
- Product display planning
- Interactive visitor engagement areas
- Meeting and hospitality zones
- LED walls and digital displays
- Smart lighting concepts
- Storage integration
Using advanced 3D rendering software, we provide realistic booth visualizations before fabrication begins. This allows you to review the design, request revisions, and ensure every detail aligns with your expectations.
Turnkey Exhibition Booth Solutions
Managing an exhibition project involves much more than designing a booth. Coordinating multiple vendors, handling logistics, and meeting strict event deadlines can quickly become overwhelming.
Our turnkey exhibition services simplify the entire process by providing everything under one roof.
Our comprehensive solutions include:
- Exhibition booth design
- Booth fabrication
- Graphic production
- Flooring installation
- Furniture rental
- Lighting systems
- Audio-visual integration
- Electrical work
- Logistics management
- Booth transportation
- Installation
- Dismantling
- Storage solutions
- On-site technical support
- Dedicated project management
With a single point of contact throughout the project, communication becomes easier, timelines stay on track, and your exhibition experience becomes stress-free.
High-Quality Booth Fabrication
Quality fabrication plays a vital role in the overall appearance and durability of an exhibition booth. As an experienced Trade Show Booth Builder in Las Vegas, we use premium materials and advanced manufacturing techniques to produce exhibition booths that meet international quality standards.
Our fabrication capabilities include:
- Custom woodwork
- Modular booth systems
- Metal fabrication
- Acrylic displays
- Fabric structures
- LED integration
- Graphic printing
- Premium surface finishes
Every booth is manufactured with precision, ensuring excellent craftsmanship, structural stability, and a polished professional appearance.
Professional Installation and On-Site Support
Even the best-designed booth can face challenges without proper installation. Our experienced installation teams ensure every component is assembled accurately and on schedule.
Our on-site services include:
- Venue coordination
- Labor supervision
- Electrical installation
- Graphic application
- Furniture placement
- Audio-visual setup
- Final quality inspection
- Technical troubleshooting
During the exhibition, our support team remains available to resolve any unexpected issues quickly, allowing your staff to focus on engaging visitors and generating leads.
Booth Solutions for Every Industry
We provide custom exhibition booth solutions for businesses across a wide range of industries, including:
- Technology
- Consumer Electronics
- Healthcare
- Pharmaceuticals
- Medical Equipment
- Automotive
- Manufacturing
- Construction
- Food & Beverage
- Hospitality
- Retail
- Fashion
- Renewable Energy
- Education
- Industrial Equipment
- Logistics
Each industry has unique exhibition requirements, and our experienced team develops booth solutions tailored to your specific products, services, and marketing goals.
Sustainable Exhibition Booth Design
Sustainability has become an important consideration for modern exhibitors. Many businesses now seek environmentally responsible exhibition solutions without compromising design quality.
We offer sustainable booth options that include:
- Reusable modular booth systems
- Eco-friendly construction materials
- Recyclable graphics
- Energy-efficient LED lighting
- Lightweight transport solutions
- Reduced material waste
These sustainable practices not only reduce environmental impact but can also lower long-term exhibition costs for businesses that participate in multiple trade shows each year.
Choose Trade Show Exhibition Booth Builder in Las Vegas
Choosing the right exhibition partner directly impacts the success of your trade show participation. Our experienced team combines creative design, quality manufacturing, and professional project management to deliver exhibition booths that exceed client expectations.
Why clients choose us:
- Custom booth design tailored to your brand
- Innovative 3D booth visualization
- Complete turnkey exhibition services
- High-quality booth fabrication
- Experienced project managers
- On-time delivery
- Local installation expertise
- Professional dismantling services
- Dedicated on-site support
- Transparent communication throughout the project
Our commitment to quality, creativity, and customer satisfaction has helped businesses from around the world create successful exhibition experiences in Las Vegas.
Maximize Your Trade Show ROI
An exhibition is a significant marketing investment, and maximizing your return requires careful planning. Beyond booth design, we help exhibitors optimize visitor engagement by incorporating interactive displays, digital presentations, product demonstrations, and comfortable meeting spaces that encourage meaningful conversations.
A strategically designed booth can:
- Increase visitor engagement
- Improve brand recall
- Generate qualified leads
- Support product launches
- Strengthen customer relationships
- Create social media opportunities
- Enhance overall event performance
By combining creative design with practical functionality, we help businesses transform exhibition participation into measurable business success.
Partner with a Trusted Exhibition Booth Builder
Whether you’re preparing for your first trade show or managing a global exhibition calendar, having an experienced booth partner can simplify every aspect of your event. From initial concept development and 3D design to fabrication, logistics, installation, and dismantling, our turnkey solutions ensure a seamless exhibition experience.
As a leading Trade Show Exhibition Booth Builder in Las Vegas, we are committed to delivering custom booth solutions that capture attention, reflect your brand identity, and help you achieve your exhibition objectives. Contact us today to discuss your upcoming trade show project and discover how our custom booth design and build services can elevate your presence on the exhibition floor.
Author

Every successful enterprise has a growth story.
New customers arrive.
Revenue increases.
Teams expand.
New markets open.
Technology evolves alongside the business or at least, that’s the expectation.
In reality, growth often creates something far less visible.
It creates technical debt.
Unlike financial debt, technical debt rarely appears in annual reports. It doesn’t trigger boardroom alarms or immediate budget reviews. Instead, it quietly accumulates behind the scenes until one day the organization realizes that every new initiative takes longer, costs more, and delivers less value than expected.
For many enterprises, technical debt has become one of the biggest obstacles to innovation.
What Is Enterprise Technical Debt?
Enterprise technical debt isn’t simply outdated software.
It’s the accumulated complexity created by years of quick fixes, disconnected systems, temporary integrations, custom developments, and overlapping business applications.
Imagine renovating an office building for twenty years without ever redesigning its blueprint.
Walls are added.
Rooms are divided.
Electrical systems are extended.
New entrances appear.
Eventually, the building still functions but nobody fully understands how everything connects.
Enterprise technology evolves in much the same way.
The Warning Signs Are Easy to Miss
Technical debt doesn’t arrive with an error message.
It reveals itself through everyday frustrations.
Projects that once required three months now take nine.
Simple reporting requests involve multiple departments.
Every software upgrade creates concerns about breaking existing integrations.
Employees maintain spreadsheets because they no longer trust system data.
These problems often become accepted as “the way we work.”
They shouldn’t be.
Reduce Complexity Before It Slows Growth
Every new system should move your business forward, not create another layer of technical debt. Discover how Deister’s AI-native ERP platform helps enterprises simplify operations, modernize infrastructure, and build a connected foundation for long-term growth.

Why Business Growth Creates Complexity
Growth introduces legitimate business needs.
A new warehouse requires inventory software.
A regional office adopts different operational processes.
Customer service implements another platform.
Finance adds specialized reporting tools.
Each decision solves an immediate challenge.
Collectively, they create an increasingly fragmented architecture.
Ironically, organizations become more digitally mature while simultaneously becoming more operationally disconnected.
The Cost Goes Beyond Technology
Technical debt affects far more than IT departments.
Operations lose visibility across the business.
Finance spends valuable time reconciling conflicting reports.
Supply chain teams respond more slowly because information is scattered across systems.
Executives delay strategic decisions while waiting for reliable data.
Customers experience slower service.
Innovation slows because every new project must first navigate years of accumulated complexity.
The true cost is measured in lost agility.
Why ERP Modernization Is Becoming a Business Strategy
For many organizations, ERP modernization is no longer about replacing software.
It’s about simplifying enterprise architecture.
Modern enterprises need platforms capable of connecting business functions rather than adding new operational silos.
This is where an AI-native ERP platform offers a fundamentally different approach.
Instead of layering new applications onto an already complex environment, it provides a connected operational foundation where finance, operations, procurement, inventory, and analytics work together from the beginning.
It’s a simplification.
Why Sustainable Growth Requires a Strong Technology Foundation
Many enterprises focus on expanding products, markets, and customer relationships while overlooking the technology foundation that supports them. As the business grows, disconnected systems often struggle to keep pace, creating delays, inconsistent data, and operational bottlenecks. Investing in a scalable architecture early allows organizations to innovate faster, improve collaboration across departments, and respond confidently to changing business demands without adding unnecessary complexity.
From Fragmented Systems to Operational Intelligence
Reducing technical debt isn’t only about eliminating old technology.
It’s about improving the way information flows across the organization.
An operational intelligence platform enables enterprises to transform isolated data into continuous operational awareness.
Rather than relying on multiple reports and disconnected dashboards, leaders gain a unified view of business performance.
This improves collaboration, accelerates decision-making, and reduces the hidden operational costs created by fragmented systems.
Building an Enterprise That Can Adapt
Markets change faster than ever.
New regulations emerge.
Customer expectations evolve.
Supply chains shift overnight.
Organizations carrying significant technical debt often struggle to adapt because every change requires another workaround.
Businesses built on an AI-native ERP foundation are better positioned to evolve.
Instead of continuously managing complexity, they can focus on creating value.
Final Thoughts
Technical debt is rarely created by poor decisions.
More often, it is the result of successful businesses growing faster than their technology strategy.
The challenge isn’t whether enterprises should modernize.
It’s whether they can continue growing while carrying years of accumulated complexity.
Reducing enterprise technical debt isn’t simply an IT objective.
It’s a business strategy.
Organizations that simplify their architecture, modernize through an AI-native ERP platform, and invest in connected operations will be better prepared for the next decade of growth than those that continue adding complexity one application at a time.
Author
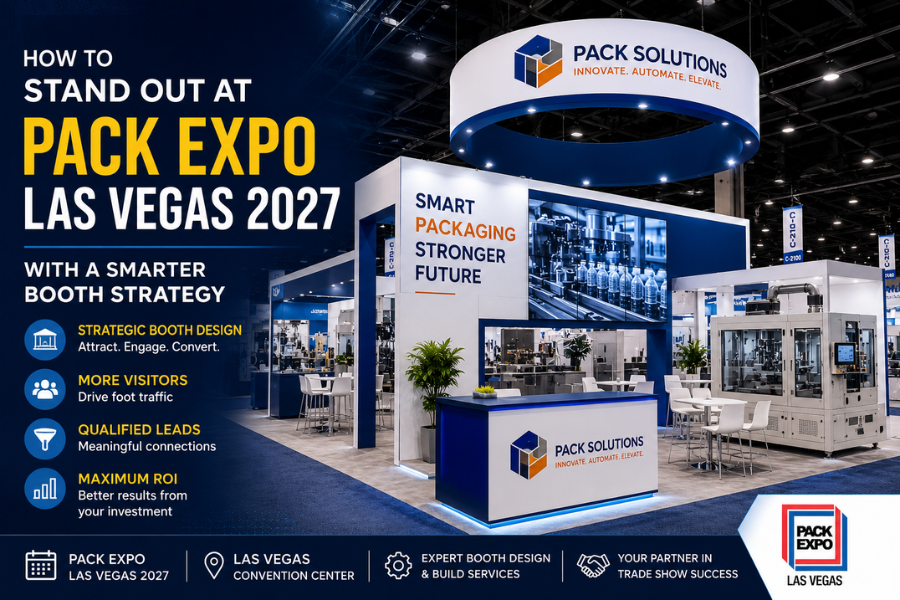
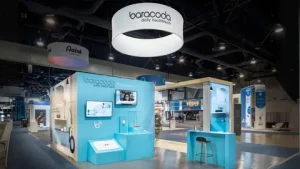
Trade shows remain one of the most effective marketing channels for businesses looking to generate leads, launch products, strengthen customer relationships, and expand into new markets. Among the industry’s most anticipated events, PACK EXPO Las Vegas 2027 will once again bring together thousands of professionals from the packaging and processing sectors under one roof.
With hundreds of exhibitors competing for attention, simply having a booth is no longer enough. Success depends on how well you engage visitors, communicate your brand value, and create memorable experiences that encourage meaningful business conversations.
Whether you’re a first-time exhibitor or a returning participant, developing a smart booth strategy can significantly improve your return on investment. Partnering with an experienced trade show booth builder for PACK EXPO Las Vegas can help transform your exhibition goals into measurable business outcomes.
Why PACK EXPO Las Vegas 2027 Matters
PACK EXPO Las Vegas 2027 is recognized as one of the largest trade shows dedicated to packaging, processing, automation, food production, pharmaceuticals, consumer goods, and manufacturing technologies. It attracts decision-makers, engineers, purchasing managers, distributors, and business owners searching for innovative products and solutions.
The event offers exhibitors opportunities to:
- Launch new products
- Demonstrate equipment in action
- Meet qualified buyers
- Build strategic partnerships
- Increase brand visibility
- Generate high-quality sales leads
However, with so many companies exhibiting similar solutions, attracting visitors requires more than attractive graphics or giveaways. It requires thoughtful planning and an exhibit designed around visitor engagement.
Begin Planning Months Before the Show
One of the biggest advantages successful exhibitors have is preparation. Starting early allows businesses to make strategic decisions instead of rushing through last-minute tasks.
Working with a professional trade show booth builder for PACK EXPO 2027 several months before the event provides enough time to:
- Define exhibition objectives.
- Design a booth that reflects your brand.
- Develop product demonstration areas.
- Finalize graphics and messaging.
- Coordinate logistics and installation.
- Train booth staff effectively.
Early planning also provides greater flexibility if adjustments are needed during the design and production process.
Design Your Booth Around Visitor Experience
Many exhibitors focus entirely on how their booth looks. While appearance is important, functionality often determines whether visitors stay or simply walk past.
An effective trade show booth design for PACK EXPO 2027 should create a welcoming environment where attendees feel comfortable exploring your products and speaking with your team.
Consider incorporating:
- Interactive product demonstrations
- Digital presentation screens
- Comfortable meeting spaces
- Open booth layouts
- Clearly visible branding
- Product display zones
- Live presentations
A booth that encourages participation naturally creates more opportunities for meaningful conversations and lead generation.
Create a Strong First Impression
Trade show attendees often decide within a few seconds whether to enter a booth. Your exhibit should immediately communicate:
- Who you are
- What products or services you offer
- What problems you solve
- Why visitors should stop
Simple messaging, high-quality graphics, and organized product displays are often more effective than overcrowded booths filled with excessive promotional materials.
A professional trade show booth design for PACK EXPO Las Vegas should balance visual appeal with clarity, allowing visitors to understand your value proposition almost instantly.
Use Technology to Increase Engagement
Today’s trade show visitors expect more interactive experiences than traditional product displays.
Technology can help make your exhibit more engaging through:
- Touchscreen product catalogs
- Interactive kiosks
- QR code demonstrations
- Product configurators
- Virtual presentations
- Live equipment monitoring
- Digital lead capture systems
These tools not only improve visitor engagement but also provide valuable data that can support your post-show follow-up efforts.
Train Your Booth Team Before the Event
Even the best-designed exhibit cannot succeed without knowledgeable and approachable staff.
Before attending PACK EXPO Las Vegas 2027, ensure your team understands:
- Company messaging
- Product benefits
- Visitor qualification techniques
- Demonstration procedures
- Lead collection methods
- Follow-up processes
Rather than immediately delivering sales pitches, encourage booth staff to ask questions and understand visitor needs first. This creates more genuine conversations and increases the likelihood of generating qualified leads.
Build Brand Consistency Throughout Your Exhibit
Every element of your booth should reinforce your brand identity.
Maintain consistency across:
- Booth graphics
- Product displays
- Digital presentations
- Marketing materials
- Staff attire
- Giveaways
- Presentation slides
A consistent brand experience helps visitors remember your company long after the event concludes.
Working with an experienced trade show booth builder ensures your branding is integrated into every aspect of the exhibit rather than appearing as disconnected design elements.
Think Beyond the Booth
Successful exhibitors understand that trade show marketing begins before attendees arrive.
Promote your participation by:
- Sending email invitations
- Posting on LinkedIn
- Sharing booth previews
- Scheduling customer meetings
- Announcing product launches
- Publishing educational content
Creating awareness before the event increases the chances that attendees will intentionally visit your booth instead of discovering it by chance.
Why Las Vegas Offers a Competitive Advantage
As one of the world’s leading convention destinations, Las Vegas attracts international exhibitors and buyers across numerous industries.
Its modern exhibition venues, hospitality infrastructure, and accessibility make it an ideal location for major trade shows like PACK EXPO.
Businesses working with an experienced trade show booth builder in Las Vegas benefit from local knowledge, smoother logistics, and efficient booth installation that helps reduce last-minute challenges.
Measure Performance Beyond Lead Numbers
Generating leads is important, but measuring overall exhibition success requires evaluating several performance indicators.
Consider tracking:
- Qualified leads generated
- Scheduled follow-up meetings
- Product demonstration requests
- Visitor engagement time
- Social media mentions
- Sales opportunities created
- Customer feedback
- Overall return on investment
Analyzing these metrics helps identify strengths and areas for improvement before your next exhibition.
Apply Your Strategy Across Multiple Trade Shows
Many companies participate in several major exhibitions each year. Instead of creating an entirely new approach every time, develop a scalable exhibit strategy.
For example, companies preparing for PACK EXPO Las Vegas 2027 may also participate in IMTS 2026 or other manufacturing events. Maintaining consistent branding while adapting messaging for each audience improves recognition and reduces planning time for future exhibitions.
This long-term approach also allows businesses to maximize the value of their exhibit investment.
Choose the Right Exhibition Partner
Your exhibit partner plays a significant role in the success of your trade show participation.
Look for a company that offers comprehensive services, including:
- Custom exhibit design
- Booth fabrication
- Graphic production
- Project management
- Shipping and logistics
- Installation and dismantling
- On-site supervision
An experienced trade show booth builder for PACK EXPO Las Vegas understands exhibition timelines, venue requirements, and production processes, helping your team focus on engaging visitors instead of managing operational challenges.
Final Thoughts
Standing out at PACK EXPO Las Vegas 2027 requires more than eye-catching graphics or premium booth space. Successful exhibitors combine strategic planning, engaging visitor experiences, consistent branding, and professional execution to maximize their trade show investment.
Starting early, investing in thoughtful trade show booth design for PACK EXPO 2027, and collaborating with a reliable trade show booth builder for PACK EXPO Las Vegas can help your business attract qualified visitors, strengthen customer relationships, and generate measurable results.
When your booth is designed around your audience rather than just your products, every interaction becomes an opportunity to build trust, create lasting impressions, and turn conversations into valuable business opportunities.
Author


Car Repair Costs: 5 Ways to Avoid Expensive Repairs Early

Echocardiogram Beveridge: Advanced Heart Imaging Services

PRP Hair Treatment: Can It Replace a Hair Transplant?

Hair Transplant in Sharjah: Natural Hair Restoration Guide

Custom Chip Cups: Boost Branding with Practical Food Packaging

Corporate Office Security Standards: 10 Essential Best Practices

Godrej Sora: Ultra Luxury Apartments in Sector 53 Gurgaon

Point Cook Apartments: Modern Living in Melbourne’s West

Essentials Hoodie: The Ultimate UK Streetwear Guide for 2026

Represent Clothing: Best Represent T Shirts for UK Streetwear

Cybersecurity Consulting Company SequelNet Provides Critical IT Support Services to Medical Billing Firm, Medical Optimum

Meet the Megalodon: The Shark Star of ‘Meg 2’

Reduce Video Game Lag: Level Up Your Gaming Performance
Balancing India’s Entertainment: Cricket vs. Bollywood

Jetsetter’s Secrets: Unveiling Our Favorite Travel Hacks for a Seamless Adventure

The 5 Best Live Sports Streaming Sites: Legal and Exciting!

Hollywood Labor Unrest: The Impact of ‘What About Us?’ Strikes

Unveiling the Magic of Dream Fulfillment at the Late NBA Draft

Illuminate Your Skin: Dr. Axe Unveils Natural Remedies for Lightening Knees and Elbows

Bright Choices: Navigating the Pros and Cons of Skin Whitening Creams with Dr. Axe
-

 Business3 years ago
Cybersecurity Consulting Company SequelNet Provides Critical IT Support Services to Medical Billing Firm, Medical Optimum
-
Entertainment3 years ago
Meet the Megalodon: The Shark Star of ‘Meg 2’
-
Entertainment3 years ago
Reduce Video Game Lag: Level Up Your Gaming Performance
-
 Sports3 years ago
Balancing India’s Entertainment: Cricket vs. Bollywood
-
Entertainment3 years ago
Jetsetter’s Secrets: Unveiling Our Favorite Travel Hacks for a Seamless Adventure
-
Productivity3 years ago
The 5 Best Live Sports Streaming Sites: Legal and Exciting!
-
Art /Entertainment3 years ago
Hollywood Labor Unrest: The Impact of ‘What About Us?’ Strikes
-
Sports3 years ago
Unveiling the Magic of Dream Fulfillment at the Late NBA Draft