
Business
Columbus Colleges: Enrollment Through Better Web Design

Columbus’s colleges are losing students to other schools simply because their websites are better structured. I found that when I audited 15 local colleges, poor design was running rampant across the board—most are fixable as well.
Slow Load Times on Mobile Devices
Ohio State’s primary website loads in just 2.3 seconds on a mobile device. Conversely, Columbus State’s website loads in 8.7 seconds. Given that 73% of prospective students use smartphones to browse, that’s not just slow, it’s a death sentence for admissions.
The Solution: Any reputable web design company in Columbus will tell you that mobile-first design is no longer up for discussion. Pages should load in 3 seconds or less, forms should be usable with a thumb, and navigation should be thumb-friendly. CCAD (Columbus College of Art and Design) just redesigned its website using these principles, and its applications have increased by 34% since the redesign.
Invisible in local search results
If you enter “colleges around Columbus” on a search engine (Google), you will see Ohio State as the only college that shows up. However, when searching for community colleges and other specialised institutions, you will find these institutions ranking around page 3 or lower for their named programs.
The problem: No GMB (Google My Business) optimisation. Franklin University even fails to fully claim their GMB listing. Their address is commonly listed as “temporarily closed.”

The Solution: Create and then optimize all campus addresses through both Google and business directory listings. Include photographs, create labels to respond to people reviewing your school, and post recent updates relating to the available enrollment periods. You want colleges to be able to locate you locally first when a prospective student types in “nursing programs Columbus” and you are visible in the map section.
Content That Converts Students
The college sites of most institutions are written in an academic style – high-density paragraphs about “excellence of the institution” and “a transformative learning experience.” When students are looking for information, they are looking for answers to questions such as how long it will take to complete the program, how much it will cost, and will there be any job opportunities upon completion.
For example, Otterbein University’s nursing website includes 847 words of content; however, it does not include the starting salary for a graduate until paragraph six. A competing institution’s website leads with, “96% job placement rate with an average starting salary of $65,000.”
Solution: answer the money questions up front and create program pages that convert:
- Job placement rates (with 3rd party sources).
- Graduate’s average starting salaries.
- Total program cost (not just tuition).
- Time to complete the program.
- Prerequisite information listed in plain English
Technical SEO Disasters
Most of the Columbus, Ohio college websites fail to meet the industry’s minimum criteria for Search Engine Optimization (SEO), which lead to decreased rankings in all search engines. The common issues we found include:
1. Broken internal links.
2. Missing alt tags on images.
3. Duplicate content across program pages (Capital University has 23 pages with the same meta description).
Some additional key technical issues that hamper the rankings on all college websites include:
1. No schema markup for either program or location.
2. Slow server response times.
3. Missing SSL certificate on multiple application forms.
4. Broken mobile navigation for multiple programs.
5. No local business structured data to support citation and rankings.
These common technical issues are far more than technical; they are also killing your rankings. Google cannot recommend college’s websites to its visitors if those sites are not accessible to Google through its crawler or can be understood once crawled.
The Death of Enrollment Forms
67% of potential students who fill out inquiry forms at Columbus colleges are lost at the inquiry stage. Why does this happen? Schools are using inquiry forms that require up to 15 fields when 4 would suffice, not having mobile-optimized inquiries, and having broken “Submit” buttons.
Delaware County Community College cut their inquiry form from 12 fields down to only 3 fields, resulting in an 89% increase in inquiries over 2 months.
Successful Examples of Results
Columbus State Community College worked with an SEO Services Columbus that specializes in local search engine optimisation and experienced the benefits:
- 156% more traffic through organic search
- 43% additional program inquiries
- Increased performance in local search results for targeted programs
Their formula for success: a mobile-first redesign, aggressive optimization of their Google My Business profile across their campuses, and totally answering students’ questions using quality content.
To sum it up
Ohio colleges have to compete against Arizona and Florida Colleges’ web-based programs with better web pages and better collegiate leads search engine optimization, so there’s no longer a local marketplace for columbus schools to get their students from.
It’s really easy to fix the problem. You’ll need to work with a web design company who understands education marketing, and to do that, you need to optimize the site for local search and generate content that gets visitors to apply.
Your competitors are already doing this, and if you wait to make decisions about how many more students you will lose to your competitors.
If you are ready to improve your school’s web presence, do a technical audit, make your mobile experience priority, and claim local search results. In a competitive academic landscape, your website serves not just for promotion, but as your enrollment powerhouse.
-

Digital Guider provides cost-effective search engine optimization services in the USA. Increase your online presence and drive organic traffic. Take your business to the next level with our affordable SEO services.


The global agricultural sector currently finds itself at a crossroads. As we move through the second quarter of 2026, the Potassium Sulfate Price Index reveals a world divided by divergent economic forces. Potassium sulfate ($K_{2}SO_{4}$), also known as Sulfate of Potash (SOP), remains the preferred fertilizer for high-value crops. However, the cost to procure this essential nutrient is far from uniform across the globe.
In March and early April 2026, the market showed a distinct “split” personality. While Western markets like Europe and North America faced sharp inflationary pressure, Asian and African markets enjoyed a rare period of relative stability. To understand why these regions are moving in opposite directions, we must look closely at production costs, seasonal demand, and the logistical hurdles of modern trade.
Regional Breakdown: Winners and Losers in the Pricing Game
1. Europe: The Epicenter of Inflation
Europe witnessed the most dramatic shift in the Potassium Sulfate Price Index this month. Prices surged by a staggering 11.9%, reaching a high of USD 0.66/kg. This jump did not happen in a vacuum. Higher input costs—specifically energy prices required for the Mannheim process—pushed manufacturers to raise their rates. Additionally, steady demand from the Mediterranean fruit and vegetable sectors kept supply tight. According to current forecasts, European prices will likely remain firm through the end of the spring planting season.
2. North America: Sustained Upward Momentum
Not far behind Europe, the North American market saw a 6.5% increase, with prices hitting USD 0.82/kg. This region currently holds the title for the highest price point globally. The driver here is a combination of strong domestic agricultural demand and rising inland transportation costs. Farmers in California and Florida, who rely heavily on SOP for citrus and nut crops, are feeling the pinch as production expenses continue to climb.

3. Northeast Asia: A Cooling Market
In a surprising turn, Northeast Asia recorded a 1.7% decline in prices, settling at USD 0.57/kg. This softening of the market is a direct result of improved local production output. As supply availability increased, the pressure on prices eased. This region currently offers the most competitive rates for buyers, though market analysts suggest this “dip” may be temporary as export activity picks up later in the year.
4. Africa and Southeast Asia: The Pillars of Stability
In these regions, the word of the month is “consistency.”
-
Africa: Prices held steady at USD 0.69/kg. Balanced supply levels and predictable import patterns have prevented the volatility seen in the West.
-
Southeast Asia: Prices remained unchanged at USD 0.65/kg. The region’s focus on rice and palm oil production provides a steady baseline for demand, allowing the price index to remain flat.
Defining the Commodity: Why $K_{2}SO_{4}$ Matters
To the uninitiated, potassium sulfate might seem like just another industrial chemical. However, in the world of high-stakes agriculture, it is indispensable. Unlike the more common Muriate of Potash (MOP), SOP does not contain chloride. Many high-value crops—such as tobacco, grapes, berries, and various nuts—are sensitive to chloride. Using a chloride-free fertilizer ensures higher yields and better fruit quality.
This “premium” status is exactly why Potassium Sulfate Prices are so closely watched. When prices rise, the cost of the berries in your grocery store or the wine in your cellar eventually follows. The price trend reflects not just the cost of dirt and minerals, but the cost of global food security and quality.
The Six Pillars Driving Price Fluctuations
Understanding the Potassium Sulfate price trend requires looking at six critical factors that dictate the market’s movement:
-
Raw Material Flow: The availability of MOP and sulfuric acid is the starting point. If these ingredients become scarce, the price of the final resin or powder inevitably spikes.
-
The Energy Equation: Producing SOP is energy-intensive. When global gas or electricity prices fluctuate, factory gates prices adjust almost instantly.
-
Agricultural Cycles: Demand is not constant. It peaks during regional planting seasons, creating temporary supply “crunches.”
-
Logistics and Freight: Moving heavy bags of fertilizer across oceans is expensive. Rising shipping rates in 2026 have added a hidden layer of cost to every kilogram sold.
-
Governmental Influence: Subsidies in certain developing nations can artificially lower prices, while environmental regulations in the West can increase production costs.
-
Climate and Weather: A late frost or a prolonged drought can shift a farmer’s fertilizer needs overnight, causing sudden ripples in the local price index.
The Strategic Path Forward for Businesses
For procurement managers and agricultural investors, navigating the 2026 market requires a proactive strategy. You cannot simply react to the Potassium Sulfate price today; you must anticipate where it will be in six months.
Data-Driven Procurement
Analyzing the Potassium Sulfate price chart over the last few years shows a clear pattern of seasonal peaks. Smart buyers are now securing contracts during the “off-season” to avoid the double-digit percentage hikes seen in Europe this March.
Diversified Sourcing
Given the price disparity between Northeast Asia ($0.57) and North America ($0.82), logistical flexibility is key. Companies that can pivot their supply chains to source from high-output, lower-cost regions will maintain a significant competitive advantage.
Future Outlook: What Lies Ahead?
The Potassium Sulfate future price remains cautiously optimistic. While short-term regional volatility is guaranteed, the long-term demand for high-quality food will support gradual price growth. As the global population nears new milestones, the pressure on arable land increases. This necessitates high-efficiency fertilizers that can squeeze more life out of every acre.
Furthermore, we are seeing a shift toward “green” SOP production. New technologies aim to reduce the carbon footprint of fertilizer manufacturing. While these sustainable practices may initially increase the Potassium Sulfate price index, they ensure the long-term viability of the industry in a world increasingly focused on ESG (Environmental, Social, and Governance) standards.
Final Verdict on the March 2026 Trend
In conclusion, the Potassium Sulfate market in March 2026 serves as a reminder of the fragility of global supply chains. The 11.9% increase in Europe and the 1.7% decrease in Asia prove that “global prices” are a myth—every market is local.
For the remainder of 2026, expect North America to remain the most expensive theater for SOP, while Asia continues to offer the most relief to buyers. By keeping a close eye on the Potassium Sulfate price history and staying informed on regional news, stakeholders can navigate these turbulent waters and ensure their crops—and their bottom lines—continue to grow.
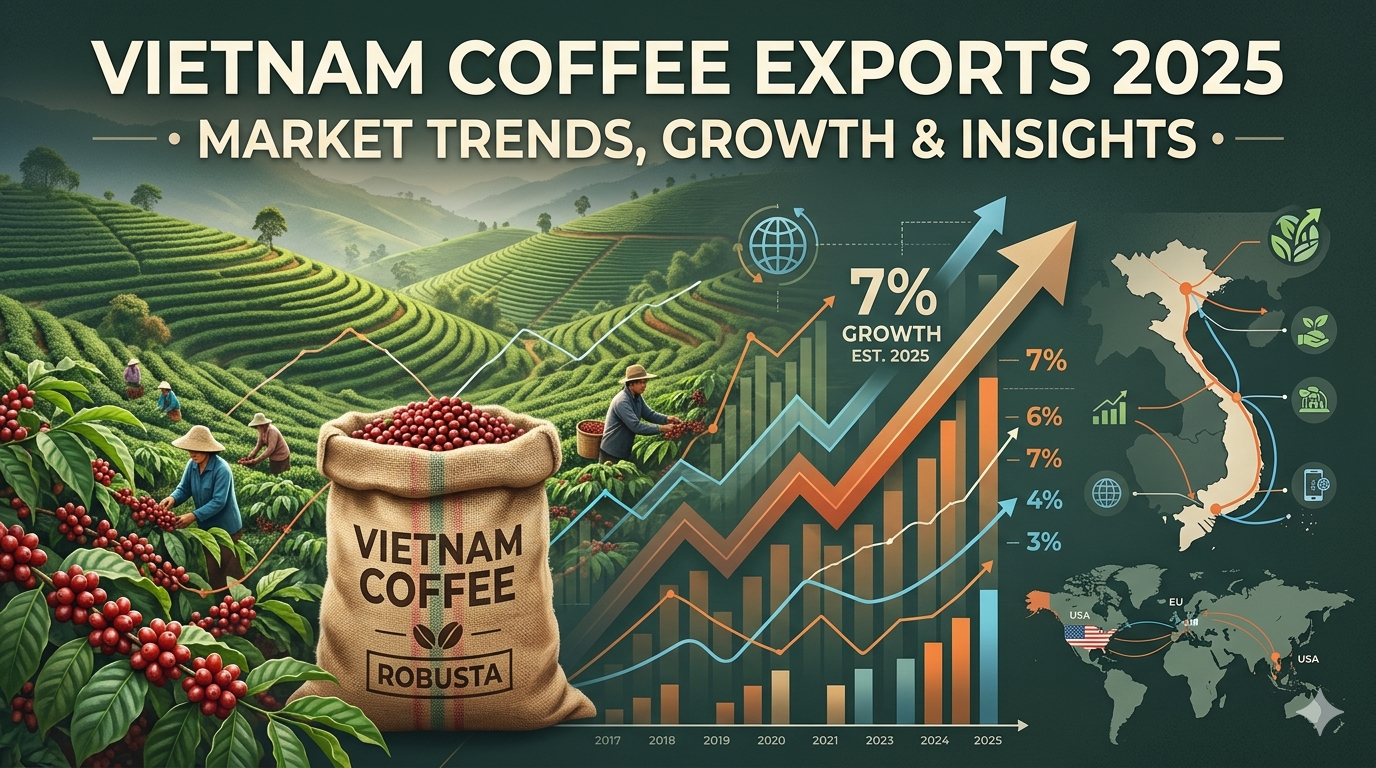
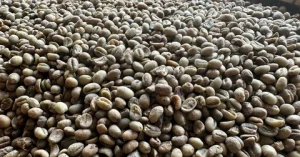
Vietnam has firmly established itself as a powerhouse in the global coffee trade, consistently ranking as the world’s second-largest exporter. Over the past decade, the country has transformed its agricultural landscape, investing heavily in coffee cultivation, processing, and global trade networks. As a result, Vietnam coffee exports have reached unprecedented levels, reflecting both rising global demand and strong pricing trends.
In 2024, Vietnam recorded coffee export revenues of $5.62 billion, marking a significant milestone for the industry. Despite fluctuations in volume due to weather conditions and production challenges, export value surged due to higher global coffee prices. Moving into 2025, the sector continues to expand rapidly, reinforcing Vietnam’s critical role in the international coffee market.
Vietnam Coffee Exports: A Record-Breaking Journey
The growth of Vietnam coffee exports has been nothing short of remarkable. Between January and December 2024, the country exported approximately 1.26 million tons of coffee. While this represented a decline in volume compared to the previous year, the export value increased sharply by over 32%, driven by rising global prices.
In early 2025, the momentum continued. During the first quarter alone, export value exceeded $2.8 billion, reflecting a nearly 74% increase year-over-year. This surge highlights how vietnam coffee exports are increasingly driven by value rather than volume.
By mid-2025, exports had already reached $4.7 billion, and projections indicate that total export revenue could surpass $7 billion by the end of the year. These figures demonstrate the resilience and adaptability of vietnam coffee exporters in a rapidly changing global market.
Key Drivers Behind Export Growth
Several factors are contributing to the impressive performance of vietnam coffee exports:
1. Rising Global Coffee Prices
One of the most significant drivers has been the sharp increase in coffee prices. Average export prices rose above $5,600 per metric ton in 2025, compared to around $3,700 in previous years. This price surge has allowed exporters to generate higher revenues even with reduced volumes.
2. Strong Demand from International Markets
Demand from major markets such as the European Union and the United States has remained robust. Consumers are increasingly appreciating Vietnamese coffee for its strong flavor, affordability, and versatility.
3. Strategic Market Diversification
To mitigate risks such as tariffs and geopolitical uncertainties, vietnam coffee exporters are diversifying into emerging markets in Asia, including China, the Philippines, and South Korea.
Vietnam Coffee Production Landscape
The success of vietnam coffee exports is closely tied to the country’s strong agricultural foundation. Vietnam coffee production is concentrated in regions like Dak Lak, Lam Dong, and Gia Lai, where favorable climate and soil conditions support high yields.
Vietnam produces approximately 1.74 million tons of coffee annually, with Robusta beans accounting for around 95% of total output. This makes Vietnam the world’s leading producer of Robusta coffee.
However, the 2023–2024 season saw a decline in production due to drought conditions, reducing output by nearly 20%. Fortunately, improved weather patterns in early 2025 have supported crop recovery, and production is expected to increase significantly in the 2025–2026 season.
Top Export Markets for Vietnamese Coffee
The global reach of vietnam coffee exports continues to expand, with key markets driving demand:
- Germany remains the largest importer, accounting for nearly 15% of exports.
- United States follows closely, showing strong growth in both volume and value.
- Italy, Spain, and Belgium are major European buyers.
- Japan and South Korea represent important Asian markets.
The European Union collectively accounts for a significant share of total exports, importing hundreds of thousands of tons annually. At the same time, Asian markets are emerging as high-value destinations, offering premium pricing opportunities.
Leading Vietnam Coffee Exporters
The success of vietnam coffee exporters is driven by a strong network of companies that have built global reputations for quality and reliability. Some of the leading players include:
- Intimex Group
- Vinh Hiep Co., Ltd
- Louis Dreyfus Vietnam
- Nestlé Vietnam
- Olam Vietnam
- Simexco Daklak
These companies play a crucial role in expanding vietnam coffee exports, ensuring consistent supply to international markets while maintaining quality standards.
Historical Growth of Vietnam Coffee Exports
Over the past decade, vietnam exports of coffee have shown steady growth, with occasional fluctuations due to market and environmental factors:
- 2014: $3.31 billion
- 2018: $2.89 billion
- 2020: $1.97 billion
- 2023: $3.18 billion
- 2024: $5.62 billion
This upward trajectory highlights the resilience of the industry and the increasing importance of coffee in vietnam exports.
Pricing Trends and Market Dynamics
The pricing environment has significantly influenced vietnam coffee exports in recent years. Export prices have surged due to global supply shortages and increased demand.
At the domestic level, farmgate prices have reached record highs, with Robusta beans selling for over $5 per kilogram. This has led farmers to hold back stock in anticipation of further price increases, creating supply constraints in the short term.
Additionally, there is a growing shift toward value-added products such as roasted and soluble coffee. These products now account for an increasing share of total exports, enhancing profitability for vietnam coffee exporters.
Challenges Facing the Industry
Despite strong growth, the industry faces several challenges:
1. Tariffs and Trade Barriers
Recent tariffs imposed by the United States on Vietnamese coffee have created uncertainty for exporters. This has prompted a shift toward alternative markets in Asia and Europe.
2. Climate Change
Weather variability continues to impact vietnam coffee production, affecting both yield and quality.
3. Supply Chain Constraints
Delays in shipments and logistical challenges can disrupt export flows, particularly during peak seasons.
Role of Vietnam Customs Data in Trade Insights
Access to accurate vietnam customs data is essential for understanding trade trends and making informed business decisions. This data provides valuable insights into export volumes, pricing, and market demand.
Businesses can leverage vietnam customs data to identify emerging opportunities, track competitors, and optimize their supply chains. It also helps stakeholders analyze the performance of vietnam coffee exports across different markets.
Future Outlook for Vietnam Coffee Industry
The future of vietnam coffee exports looks highly promising. With projected export values reaching $7 billion in 2025, the industry is poised for continued growth.
Key trends shaping the future include:
- Expansion into high-value markets
- Increased focus on sustainable farming practices
- Growth in processed coffee exports
- Adoption of advanced technologies in production and logistics
As global demand for coffee continues to rise, vietnam coffee exporters are well-positioned to capitalize on new opportunities.
Key Takeaways
- Vietnam coffee exports are experiencing strong growth driven by high prices and global demand.
- The country remains the world’s leading producer of Robusta coffee.
- Major markets include the EU, the US, and emerging Asian economies.
- Vietnam coffee exporters are focusing on diversification and value-added products.
- Insights from vietnam customs data play a crucial role in strategic decision-making.
Conclusion
Vietnam’s coffee industry has evolved into a global leader, supported by strong production capabilities and expanding export networks. Despite challenges such as climate change and trade barriers, the country continues to demonstrate resilience and adaptability.
With rising demand, premium pricing, and strategic market expansion, vietnam coffee exports are set to achieve new milestones in the coming years. Backed by reliable vietnam coffee production and data-driven insights from vietnam customs data, the industry is well-equipped to maintain its upward trajectory.
As the global coffee market continues to evolve, Vietnam remains at the forefront—delivering quality, consistency, and value to coffee lovers worldwide.


Get an EIN Number USA: Step-by-Step Guide for Entrepreneurs

Prevent Mildew & Odors in Camping Gear Naturally: Tent Solutions

Tummy Tuck in Islamabad: Body Contouring Without Surgery

Software Development Company: Services for Digital Solutions

Potassium Sulfate Prices Forecast 2026: Trends & Outlook

Vietnam Coffee Exports 2025: Key Markets & Industry Insights

Native App Development Trends: AI, IoT, Cloud & Future Insights

Metal Roof Tiles vs Concrete Tiles: Cost & Roofing Choice

Custom Packaging Boxes USA – Elevate Your Brand with Artsy Packaging

Warehouse Management System for Real-Time Control

Cybersecurity Consulting Company SequelNet Provides Critical IT Support Services to Medical Billing Firm, Medical Optimum

Team Communication Software Transforms Operations at Finance Innovate

Project Management Tool Transforms Long Island Business

How Alleviate Poverty Utilized IPPBX’s All-in-One Solution to Transform Lives in New York City

Breast Cancer: The Imperative Role of Mammograms in Screening and Early Detection

Unstoppable Collaboration: D.C.’s Citi Open and Silicon Valley Classic Unite to Propel Women’s Tennis to New Heights

Embracing Renewal: Sizdabedar Celebrations Unite Iranians in New York’s Eisenhower Park

The Benefits of Starting a Side Hustle for Financial Freedom

New Blood Donation Screening Questions What You Need to Know

Stylishly Timeless: The 5 Types of Sandals You Need in Your Closet
-

 Business3 years ago
Cybersecurity Consulting Company SequelNet Provides Critical IT Support Services to Medical Billing Firm, Medical Optimum
-
Business3 years ago
Team Communication Software Transforms Operations at Finance Innovate
-
Business3 years ago
Project Management Tool Transforms Long Island Business
-
Business3 years ago
How Alleviate Poverty Utilized IPPBX’s All-in-One Solution to Transform Lives in New York City
-
health3 years ago
Breast Cancer: The Imperative Role of Mammograms in Screening and Early Detection
-
Sports3 years ago
Unstoppable Collaboration: D.C.’s Citi Open and Silicon Valley Classic Unite to Propel Women’s Tennis to New Heights
-
Art /Entertainment3 years ago
Embracing Renewal: Sizdabedar Celebrations Unite Iranians in New York’s Eisenhower Park
-
Finance3 years ago
The Benefits of Starting a Side Hustle for Financial Freedom